Table of Contents
Debug Sage CRM with Visual Studio
Advanced Debugging with Visual Studio
Use Internet Explorer Options
Use Internet Explorer Developer Tools
Use Internet Explorer Profiler
Use Fiddler
Debug Sage CRM ASP Pages
How to Debug Sage CRM Code with Visual Studio
As soon as we started programming, we found to our surprise that it wasn’t as easy to get programs right as we had thought. Debugging had to be discovered. I can remember the exact instant when I realized that a large part of my life from then on was going to be spent in finding mistakes in my own programs. — Maurice Wilkes discovers debugging, 1949
Bugs, Bugs, Bugs – the Lesser Known Mötley Crüe Album
Like a swarm of thirsty mosquitos on a hot, humid day, software bugs are lurking in your code waiting to suck the life out of your productivity. Fortunately, the situation isn’t as dismal as it was in 1949. Debugging tools have come a long way since good ol’ Maurice had his profound realization. Thank goodness for folks like Al Gore, am I right?
The existence of incorrect stuff in your code (bugs/defects) and the need to squash them (debugging) is an inescapable part of Sage CRM development, as with any software development.
It’s not so much about whether they’ll be there or not (they will) but how quickly and effectively they can be fixed. More often than not, simply tracking down the source of problem or gaining a better understanding of the problem is the troublesome part.
So, let’s go find some bugs to squash.
Choosing Your Bug Swatter
To be a good CRM debugger, it’s imperative for you to know what tools are available and what purposes each serve.
For instance, around about the operating system level, there’s the Event Viewer, IIS logs, Apache logs, etc. At the database layer, there are very useful tools such as MS SQL Profiler, PRINT statements, a debugger within SQL Server Management Studio, and so on.
Then, let’s not forget the CRM logs which can oftentimes be very helpful in isolating problems. But… we’re not going to cover all that stuff (not in this series at least). What we will focus on, however, is debugging the code itself both on the server (.NET) and on the client (HTML, CSS, and JavaScript).
In this section, we’ll introduce you to the basics of server-side debugging with .NET using Visual Studio.
If you find yourself using Classic ASP frequently, we suggest you read through the section on debugging ASP Pages inside Visual Studio on this page.
Visual Studio has many sophisticated debugging features, so future sections will dive into advanced Visual Studio debugging features.
Then we’ll shift our focus from the server to the browser, exploring how we can use IE developer tools to troubleshoot the presentation layer (HTML + CSS) and scripting. We’ll also explore tools to profile and monitor the request/response cycle as well as keyboard/mouse interactions within the browser.
Investigating a .NET Assembly with Visual Studio – Nice Work, Sherlock
In this article, I’m using Visual Studio 2012. Fret not if you aren’t as fancy – not much has changed in Visual Studio debugging over the years, so whatever version you’re using is still applicable.
Simple Debugging for CRM – Step by Step
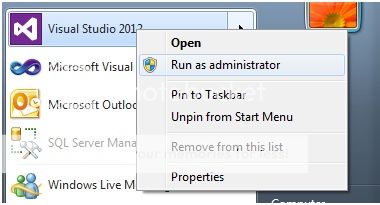
1. Launch Visual Studio. When opening Visual Studio, right-click and select “Run as administrator”. This ensures you’ll have the necessary privileges to debug an IIS worker process.
2. Open a project. To take advantage of the CRM .NET SDK (my suggestion), this should be a “Class Library” project. So, yes, we’ll be debugging a .NET DLL that’s’ invoked from Sage CRM from a tab using the “customdotnetdll” action. We’re using the same project as from How to Master .NET Web Controls for Sage CRM Today.
3. Set a breakpoint. In Visual Studio, this is accomplished by left-clicking in the margin for the line of code you want to “break” at. You have a breakpoint set when it’s a solid red circle. An empty circle with a red border implies there’s a breakpoint but that it’s disabled.
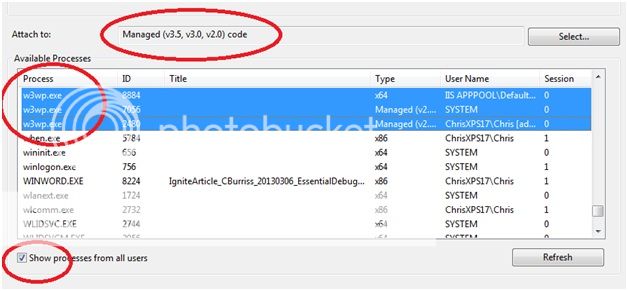
4. Attach to the IIS process. From Visual Studio, go to “Tools” > “Attach to Process”. Set “Attach to” to “Managed (v3.5, v3.0, v2.0) code”, select all w3wp.exe processes (ensuring “show processes for all users” is checked), and finally click the Attach button.
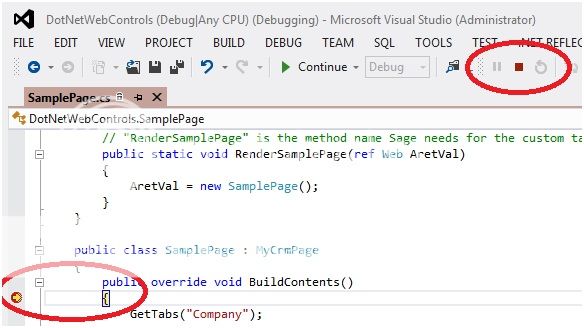
5. Initiate debug sequence. At this point, the debugger has attached to the process and is waiting for the breakpoint’s line of code to be hit. To trigger the debugger, simply go through the necessary steps within the CRM application to invoke that line of code. In this case, our breakpoint is at the entry point for the BuildContents method.
As such, simply clicking the custom tab in Sage CRM will suffice. Going back to Visual Studio, the code is now halted at our breakpoint, awaiting our next action. If you wish to stop debugging, simply click the stop icon.
6. Step through the code. Visual Studio has several additional commands to step through code however the most common are Step Into, Step Over, and Step Out. These do the following:
Step Into: Steps into a method (which includes properties, constructors, destructors, etc.) to investigate its internal implementation.
Step Over: Executes the statement but without stepping through the internal implementation.
Step Out: Exits the current class member and returns to the calling statement.
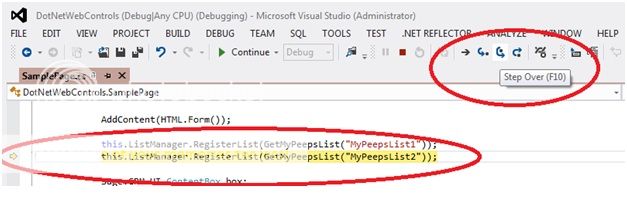
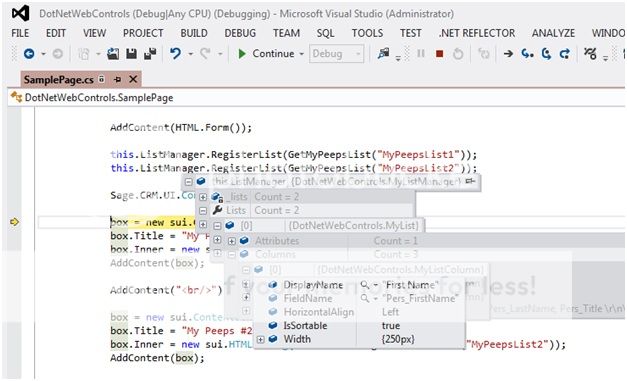
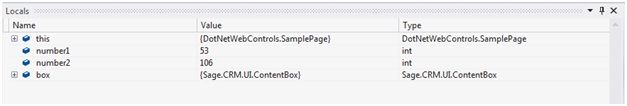
7. Lastly, let’s investigate the state of our .NET objects. Step through until you get just past registering the two example lists. Then, move your mouse over the ListManager instance under the this object. Expand via plus sign. You’ll see all of the class members which can then be drilled into further.
In this example, I’ve drilled into Lists (collection of registered Lists), then Lists[0] (1st list object in collection), then Columns (collection of columns within the 1st list), and Columns[0] (the 1st column within that list) to view the assigned column properties.
Stepping Out
Though we’ve just begun our journey in stepping through the exciting world of debugging tools, we hope you’ve found this introductory article on .NET debugging for CRM helpful. In the coming sections, we’re going to pick up the pace and dive into much more advanced debugging topics.
Though we’ve come a long way since 1949, debugging will likely always be a major factor in our ability to deliver and maintain valuable solutions for our CRM users. Developing your skills as a top-notch Sage CRM debugger will go a long way in keeping clients happy and effectiveness high.
Until next time, here’s to wishing you happy Sage CRM coding debugging.
Return to Top
How to Perform Advanced Sage CRM Debugging with Visual Studio
The most effective debugging tool is still careful thought, coupled with judiciously placed print statements. – Brian W. Kernighan
Professor Kernighan (co-creator of UNIX if you’re wondering) said it right: creative and analytical thinking remain the best tools for troubleshooting code. But code is notorious for being complex and is oftentimes downright mind-wrenching. Without the right tools to inspect your code’s intricacies, debugging can be a daunting task. Enter Visual Studio.
Visual Studio – The Mightiest Bug Swatter I Ever Did See
We love developing server-side code using the CRM .NET SDK. A major reason for this is that Visual Studio makes it so much easier to debug code. Your ability to isolate issues in your code often boils down to understanding what is actually happening.
In other words, we need visibility into the inner workings of your code. What values do your variables have at a given point? What behavior are you observing as you step through each line of code? And so forth.
Visual Studio, with judiciously placed breakpoints, can provide these answers.
In this section, we’re going to explore some of the more advanced debugging features of Visual Studio. As in the previous section, we’re using Visual Studio 2012 and the custom CRM list project (How to Master .NET Web Controls For Sage CRM Today).
The Sage CRM Debugger’s Cockpit
First off, let’s take a look at some of the more common windows you can use in Visual Studio when debugging.
Beyond simply hovering over variables in the code window (or pinning them) to see their values, these debug windows provide a lot of insight into what is going on with the code at the time of execution. To open these, you need to be debug mode (i.e. attached to the w3wp process). Once in debug mode, navigate to Debug > Windows.
Let’s look at the ones you’re most likely to benefit from as a Sage CRM developer.
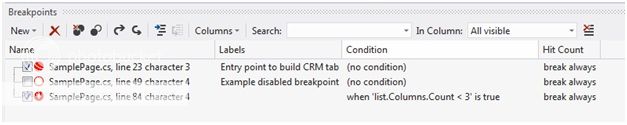
Breakpoints Window
This helpful window lists the breakpoints currently set within the solution. Note the labels I specified; this is useful for keeping track of what is what. The second breakpoint is disabled as evidenced by the white circle with a red border. The last one has a breakpoint condition (more on this later) that will only be hit when the count of list columns is less than three.
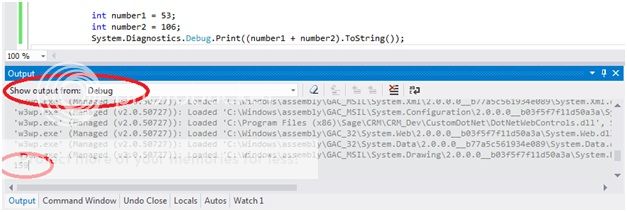
Output Window (Debug)
Within the System.Diagnostics namespace, there are many classes related to error logging, debugging and so on. One particularly useful class is Debug. From this class, for instance, you can call the static method Print to write data to the Debug Output window. In this example, I’m printing the sum of two numbers.
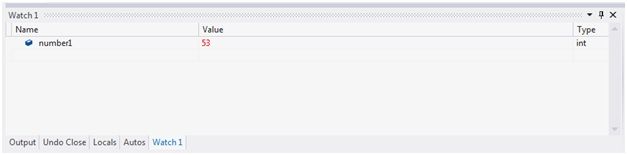
Watch Window
If there’s a variable you need to keep an eye on, the Watch window can help with that. Once in debug mode, you simply select the variable of interest and drag it into the Watch window. Alternatively, you can right-click the variable and select Add Watch. If the last line of execution causes the object to change values, the value will change to a red color making it easier to spot.
Autos and Locals Windows
These two windows are very similar. The Locals window shows all objects currently in scope. The Autos window is a subset of the Locals window and shows both the current statement and the previous statement.
So, whereas the Watch window allows you to focus on specific objects of interest, the Autos and Locals windows make it easy to view objects and their state as you step through different sections of code. Hence, objects within these windows come and go whereas the Watch window is more or less static (though objects do go in and out of scope).
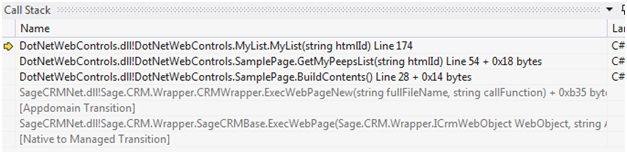
Call Stack Window
Last but not least in our windows showcase, we have the Call Stack window. It’s incredibly common to have code that has methods that call other methods that in turn call even more methods, and so on.
By reviewing the call stack, you can see exactly what calls got you to the current line of execution. As with any stack trace, the most recent call is the topmost call displayed.
I’m the Boss – You’ll Break When I Say So
Moving on, let’s explore a few ways to control debug flow. In the last section, we took a brief glimpse at the most common debug actions: Step Into, Step Over and Step Out.
The actions that follow are lesser known. Being the boss has its perks.
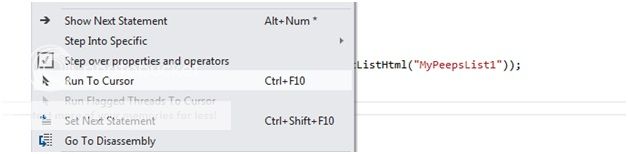
Run to Cursor
Step over, step over, pluck some banjo strings, step over, step over, take a quick nap, more stepping over… what a drag!
It’d be fantastic if you could skip down to the code line you’re interested in. As it happens, that is within the realm of possibility with Visual Studio.
Simply right-click the line of interest and select Run To Cursor. Code fast-forward!
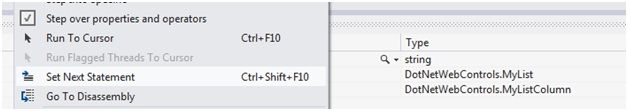
Set Next Statement
Do you ever step through your code and accidentally skip over a variable you needed to investigate? Drats!
Fear not, fellow Sage CRM coder – if you haven’t stepped out of the method, you can right-click on the code line you want to go back to and select Set Next Statement. Code rewind!
Conditional Breakpoints
Imagine you have a query that’s pulling back one gazillion records (plus or minus a few). After some clever detective work, you figure out that your code is throwing an exception at record one million.
Are you going to step through one million times? The answer is yes. You do actually need to step through one million times. Okay, okay, you caught us.
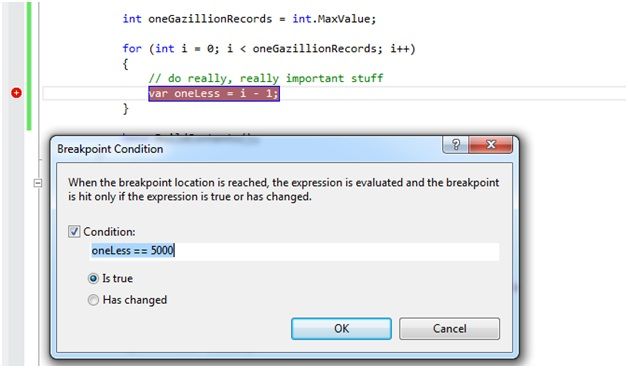
What we need here is a conditional breakpoint. If you right-click a breakpoint, there are several options to control when the breakpoint triggers.
In this example, we’re using a condition. In running this code, the execution will only break once the variable oneLess is equal to 5,000. That will save you mucho time… and probably decrease your risk of carpal tunnel.
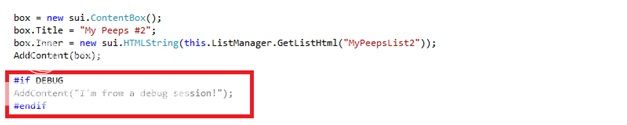
#if DEBUG … #endif
This nifty .NET feature falls under the classification of compiler directives.
This is a feature of .NET that few developers are even aware of. This is unfortunate because compiler directives, especially the #if DEBUG directive, can be quite useful.
Code within this directive will only execute if the DLL is compiled in debug mode. Hence, if the solution is in debug mode, you may choose to log more information and possibly even have different environmental configurations (development machine settings, e.g.). Sweet!
Run To Cursor
That concludes our look at server-side debugging with Visual Studio.
In the next few sections, we’ll shift focus to the browser to sharpen our client-side debugging skills.
We’ll start by investigating (or exploring, if you will) Internet Explorer’s developer tools, specifically looking at how we can troubleshoot and manipulate the presentation layer (HTML + CSS) of our CRM customizations. We know you’ll enjoy it.
In the meantime, we hope you put the Visual Studio debugging features you learned to good use. You’re well on your way to debugging awesomeness!
Return to Top
How to Debug Sage CRM with Internet Explorer Tools
I don’t like Dijon or honey mustard. No, the only kind of mustard I like is #FFFF00 mustard.– A lover of HTML color codes (and apparently yellow mustard)
In the first two sections, we explored server-side debugging in Visual Studio. In this article, we begin our transition to the client side of things (i.e. the Internet browser).
More specifically, we’re going to look at Internet Explorer’s developer tools to see how it can help us investigate the HTML, CSS and JavaScript that drive Sage CRM’s out-of-the-box functionality as well as our own customizations.
It doesn’t matter whether you’re customizing Sage CRM using the .NET SDK, Classic ASP or simply working with CRM metadata (e.g. adding custom content to a screen). Ultimately, these approaches are there to produce an HTTP response in the form of HTML, CSS and JavaScript, the universal technologies of the web.
These technologies are the bread and butter for any Sage CRM developer. Hence, the more tools you’re aware of and know how to use, the better off you’ll be.
This is not only relevant in troubleshooting your own code but also in investigating the HTML structure, CSS classes and JavaScript functions that make Sage CRM tick.
With Sage CRM now officially supporting other browsers, it is more feasible than ever to leverage non-IE browser tools. Google Chrome, for instance, has its own developer toolkit that is quite nice. Then there is Firefox’s popular extension, Firebug, which has long been coveted by web developers.
We won’t pretend that Internet Explorer has the best client-side debugging tools because we don’t think it does.
But, as a Sage CRM developer, Internet Explorer is the browser you likely spend the most time in. Hence, for the sake of convenience, IE’s developer tools can be a great place to start.
Let’s get going by looking at some of the HTML and CSS capabilities…
Opening Remarks
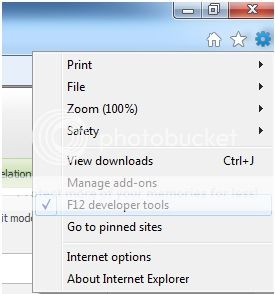
Launching developer tools within Internet Explorer 9 (what I’m using) is quite simple. The easiest way to do this is to use the keyboard shortcut which happens to be F12. Alternatively, if you prefer the scenic route, you can navigate to Tools > F12 developer tools.
Note: The developer tools window is specific to a particular browser session. If you find that things aren’t working as you expect, try closing the developer tools window then re-opening with the browser tab of interest being the active one.
Note 2: Internet Explorer, Google Chrome and Mozilla Firefox all follow the F12 convention to launch developer tools.
Viewing HTML
Perusing the raw string representation of HTML is okay for a quick glance.
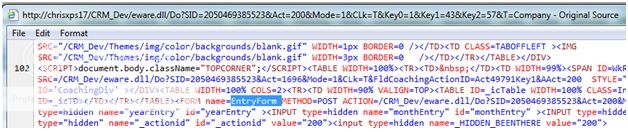
For instance, if you want to do a quick check to ensure the page has a form element, you can right-click the page and select View Source. From here, youcan do a quick search for “form” or “EntryForm”.
Great… the form is there and the page should post on submit. That was easy enough. Beyond this simple assessment, however, the raw source is not a very effective way to view the HTML for a given page.
Enter the all mighty HTML tab…
Now You Node
Using IE developer tools, you have several tabs at cursor’s reach, all of which you’ll touch on in this series.
The aptly named HTML tab is used to view (and interact with) the HTML of a web page. Beyond being able to see the attributes of the elements, the nodes are organized by hierarchy making it much easier to navigate.
Also of great usefulness for CRM pre-v7.2, we can see the full HTML document to include the frameset hierarchy.
Highlighted here is the ever popular form element EntryForm. Note that the form element is not only highlighted within the HTML tab but also on the page itself. Organized as expandable nodes, this is a great way to troubleshoot HTML.
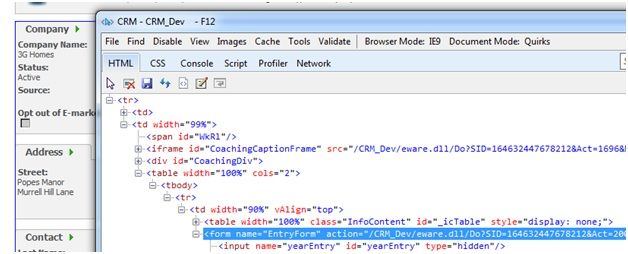
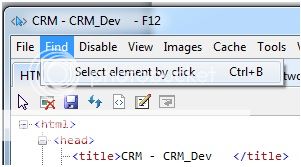
Alternatively, you can click elements on the web page as an easy way to navigate to or find an element. This is accomplished via Find > Select element by click. Once this action is initiated via the menu or keyboard shortcut, simply click something on the web page and IE developer tools will select the relevant node within the HTML tab.
Attributed to Developer Tool Awesomeness
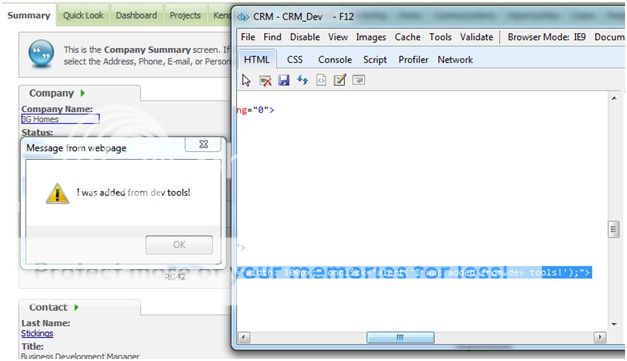
Something that is also pretty nifty (and maybe even useful) is the ability to edit the content of the HTML directly to see its effect.
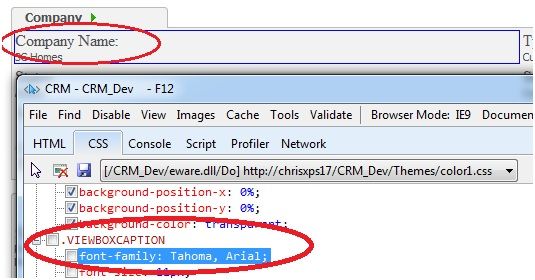
For illustration purposes, we’ve added an onclick attribute to the company span tag.
Now That’s Style
In terms of what is actually rendered within the browser window, the page’s markup (i.e. HTML) is only part of the picture.
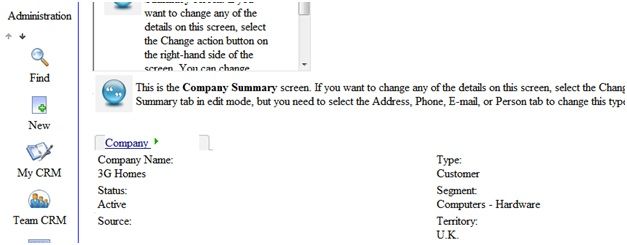
CSS makes quite an impact and does so with style. By disabling the page’s CSS via Disable > CSS within IE developer tools, it’s evident how much CSS affects a given CRM page.
When you consider the mix of style sheets, page-level style blocks and element-level inline styles, knowing what styles are being applied to a given element can sometimes be challenging without the right tools.
The CSS Tab
The CSS tab has useful features to test CSS classes defined within a style sheet. This includes CRM’s configurable themes or .css files you create for your own customizations.
In this example, we’ve disabled the VIEWBOXCAPTION class for color1.css. This particular CSS class defines the font-family and font-size styles for field labels. By simply unchecking the style (or an individual property), we can quickly see the styling contributions that particular CSS class makes to the page.
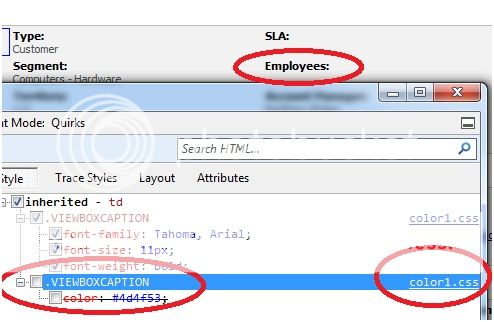
Similarly, if you have an element selected within the HTML tab, you can toggle styles and CSS classes applied to a particular element. This is possible from the Style panel on the HTML tab as demonstrated here.
Thinking Within The Box
If you’ve spent any time at all with CSS, you’re probably aware of the “box model”.
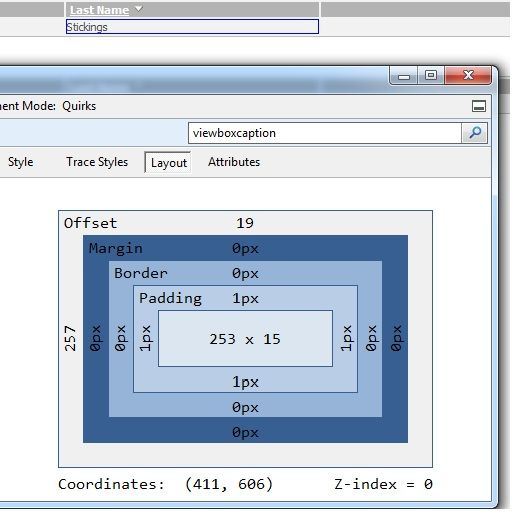
At minimum, an element’s padding, border and margin will determine its visible location. Then, you have additional aspects to consider such as display (e.g. block or inline), position (e.g. absolute or relative) and top/bottom/left/right (e.g. -25px). Lastly, there’s the z-index property which can influence whether an element is even visible or not. Given all of that, it’s quite useful to be able to see the applied layout characteristics of an element.
Not surprisingly, IE developer tools has a way to view the layout as illustrated here.
</body>
There you have it, folks… Internet Explorer can still serve a purpose. Though markup and styling aren’t quite as exciting as code, these are skills we must have to be an effective Sage CRM developer.
And where there is development, there will be debugging!
In the next section, we’ll continue our exploration of Internet Explorer’s developer tools by focusing on the scripting side (i.e. JavaScript) of client-side development.
Return to Top
How to Debug Sage CRM with Internet Explorer Developer Tools
As users are increasingly exposed to richer, more sophisticated web interfaces, they come to expect more from all web applications. Your Sage CRM customizations are no exception, and to create robust user experiences requires that you write JavaScript.
And, as you know… where there is code, there will be debugging.
Headline reads: “Browser Wars – IE Brings Knife to Gun Fight”
In this article, we continue our investigation of Internet Explorer Developer Tools, specifically looking at JavaScript inspection and debugging. To be frank, there are much better options than Internet Explorer when it comes to troubleshooting JavaScript.
Firebug, the renowned web developer plugin for Mozilla Firefox, is arguably the best. Google Chrome’s developer tools are also quite good. Nevertheless, Internet Explorer can offer assistance to you when in a pinch.
Browsers aside, being exposed to client-side debugging beyond simple alert boxes is beneficial.
In prior sections, we discussed how to inspect HTML and CSS.
This time around, we’re interested in the Console and Script tabs of Developer Tools. The Console tab is simply a larger view of the Console panel in the Script tab; other than that, it displays the same information.
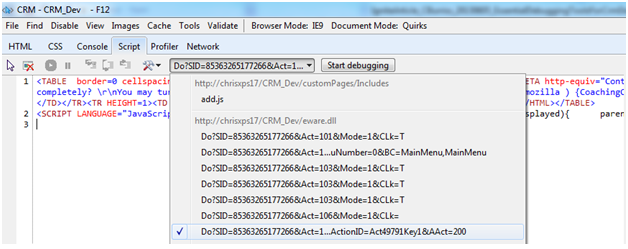
On the Script tab, pick the source file of interest by selecting the script file from the dropdown as illustrated. This will display the contents of the source in the Script tab.
The Anti-Minify (sort of)
Code as a garbled mess is very difficult to debug.
This is particularly common in client-side scripting because the code is often minified or injected server-side with no concern for formatting.
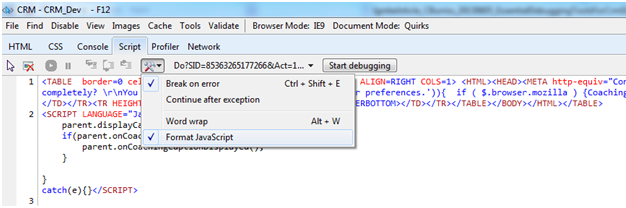
Though you can never fully reverse minified code, as sensible variable names have been replaced with short, arbitrary ones, you can at least apply formatting to make the code easier to read. To apply formatting to a page with script, select Format JavaScript in the Tools dropdown. This should make the JavaScript easier to inspect.
Note: only script blocks and script files will be formatted; inline JavaScript is not.
To Err is Human; to Err More So is JavaScript Developer
Because JavaScript doesn’t have compile-time checking, it’s quite easy to make mistakes.
Let’s suppose you have the below code in which you’re creating an object from JSON. You fail miserably with a syntax error – you miss the closing quote on a string. This will effectively break your code. You observe erratic behavior on your page. How do you go about investigating this matter?
![]()
We suggest you start with unhandled exceptions and syntax errors as Internet Explorer will notify you of these.
There are a few ways to accomplish this. For one, you can enable script error notifications (Internet Options > Advanced > Display a notification about every script error); when errors occur, an alert will be displayed.
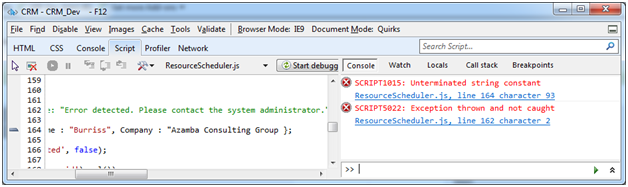
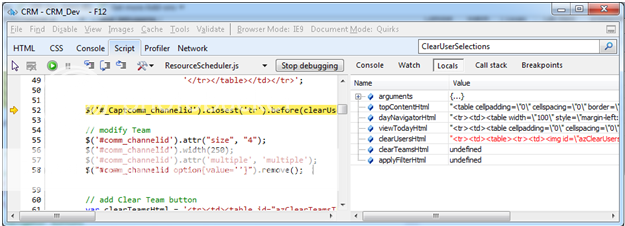
Alternatively, you can look in the Console window which is the route we advise.
In the screen capture, note the “Unterminated string constant” error on account of our syntax discrepancy. By clicking the link directly below the error, the cursor is positioned near the source of the problem.
As further illustration, we’ve thrown an unhandled exception which is also logged to the Console window.
Writing to Console
In addition to viewing messages logged by Internet Explorer, you can also write to the log from your own code.
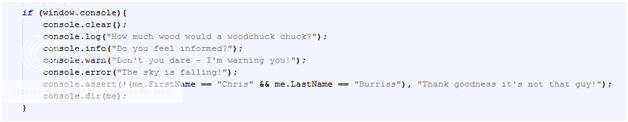
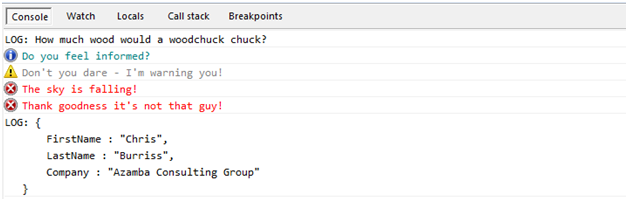
This can be very useful to print out the state of variables, note warning conditions, etc. during the debugging process. The main functions are as follows:
- console.clear() – clears the contents of the console window.
- console.log(msg) – logs the message in a general way.
- console.info(msg) – logs the message with an icon and text color indicative of an informational message.
- console.warn(msg) – logs the message with an icon and text color indicative of a warning.
- console.error(msg) – logs the message with an icon and text color indicative of an error. console.assert(condition, msg_when_false) – logs the provided message if the condition is false.
- console.dir(obj) – outputs the object properties. If nested objects are present, these will need to be printed separately. Alternatively, a recursive function can be used to include nested objects.
Stepping Through
In sections, you learned how to set breakpoints in Visual Studio and step through code. You also learned about watches, locals, the stack trace and inspecting the state of runtime objects.
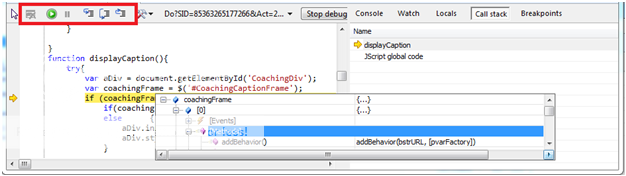
Developer Tools has similar debugging capabilities, just in a much less impressive way. Nonetheless, it is possible to set one or more breakpoints, initiate debugging (click the Start Debugging button), and step through the code using Step In, Step Over, and Step Out.
These concepts are described in detail within the first two sections, so we encourage you to give them a read if you haven’t already done so.
</script>
We hope you’ve enjoyed this article on debugging client-side script with Internet Explorer Developer Tools.
JavaScript development in Sage CRM can be a lot of fun and provides the means to create an enhanced user experience that drives increased value and productivity.
Familiarizing yourself with client-side debugging tools can go a long way towards making you more effective in that pursuit. In the next section, we’ll look at the Profiler and Network tabs of IE Developer Tools.
Capturing and analyzing client-server interaction in the form of HTTP requests/responses will escalate your debugging capabilities to a whole new level.
Return to Top
How to Debug Sage CRM with Internet Explorer Profiler
When we first discovered SQL Server Profiler, it was a true game changer.
From that point forward, we had at my disposal the means to observe the database interactions of the applications we worked with.
That single tool had an immediate and prolonging impact – it sped up development, served as an invaluable tool for troubleshooting, provided insights into the workings of SQL Server, and allowed us to investigate applications other than our own with relative ease.
As web developers, we had a similar jolt in effectiveness when we discovered Fiddler.
Similar to how SQL Server profiler allows you to monitor database interactions, Fiddler monitors the HTTP interactions between the browser and web-based resources. Fiddler captures all HTTP requests and responses and provides a ton of features to aid in debugging and investigation.
In this section, we want to start by concluding our look at Internet Explorer Developer Tools but end with an introduction to Fiddler, a true game changer for CRM debugging.
Play Ball!
There are two primary features we haven’t yet covered about IE Developer Tools, the first of which is the Profiler tab.
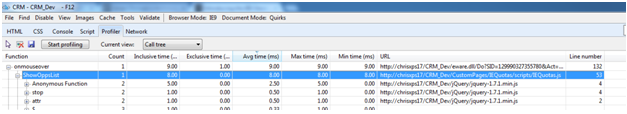
The Profiler tab reports on JavaScript-related performance data. Though the focus of our conversation is not on performance optimization of our CRM code, it is worth pointing out because a long-running JavaScript function or large variance between the average and min/max times may indicate a problem.
In this screenshot, you can see a snippet from a profiled page displayed in call tree mode.
Profiling a Suspect
Usage is straightforward. Simply click start profiling to begin, perform the suspect actions in CRM, and then click stop profiling.
Stats, Stats, Stats
The Profiler tab provides many useful statistics to better understand how code is performing. Here are definitions for the available data columns:
- Function – the function name. Anonymous functions are labeled accordingly.
- Count – total number of calls made to the function.
- Inclusive Time (ms) – total time spent in the function and its children.
- Inclusive Time % – percentage of time spent in the function and its children.
- Exclusive Time (ms) – total time spent in the function, not including children.
- Exclusive Time % – percentage of time spent in the function, not including children.
- Avg Time (ms) – average time spent in the function and its children.
- Max Time (ms) –maximum time spent in the function and its children.
- Min Time (ms) – minimum time spent in the function and its children.
- URL – source file where the function is located.
- Line Number – line number where the function starts within the source file.
Note: by default, only a subset of the available columns is shown. To change the visible columns, right-click the background area and then select add/remove columns. Toggle visibility for the data columns as desired.
IE Developer Tools – Last But Not Least
The Network tab of Internet Explorer Developer Tools allows you to capture HTTP traffic between your browser and web-based resources. Just like with Fiddler (on deck next), the function of this tool is to monitor and analyze the request/response cycle of web applications.
In fact, this tool shares many similarities with Fiddler but has a few disadvantages – namely, the feature set is rather basic, it’s browser-specific, and it’s just not as easy to use.
Nevertheless, if you are unable to install Fiddler (or its recording-only version, FiddlerCap) you can always fall back on IE Developer Tools.
Viewing what is happening behind-the-scenes with CRM can be extremely valuable for troubleshooting many issues.
If the problematic code uses AJAX calls, for instance, but does not properly bring errors to the surface, you may be completely unaware of them. In many cases, the page may simply elicit odd behavior. Upon closer investigation of the responses, you may find that the AJAX resource is actually returning invalid data or an error.
Capturing a Suspect
Similar to the Profiler tab, first click start capturing to initiate the capture, perform the CRM actions of interest, then click stop capturing. The sessions are visible in two modes: summary view and detailed view.
Summary View
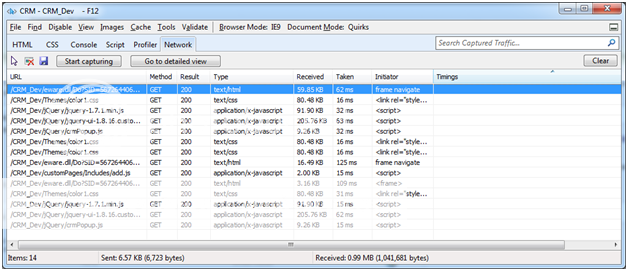
The summary view displays all HTTP sessions that occurred while capturing was turned on.
You’re able to see the source file, the method (i.e. HTTP verb), result code (e.g. 200 for a successful request), content type (e.g. text/html), and so on. If an image is not displaying or CSS styles are not being applied as you expect, consider capturing the traffic for the page and reviewing the result codes.
In many cases you may find you’re getting a 404 error, indicating the web-based resource could not be found.
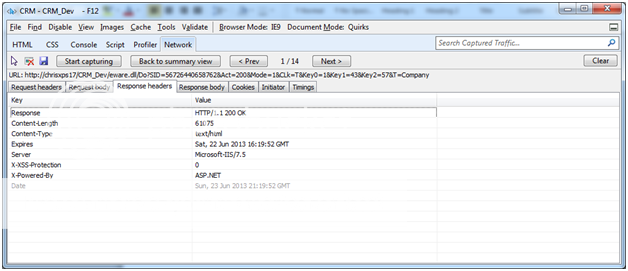
Detailed View
If you double-click a session or click Go to detailed view, you’ll see the details for the particular session, and have options to traverse the sessions via previous and next buttons.
From here, you can see the request header and body, the response header and body, and additional information such as cookies and timing information.
When troubleshooting problems, we typically look at the HTTP request to validate the URL, query string parameters, and body (when submitting from a HTML form). We also review the response body to see what was returned from the web server.
If using AJAX calls you may very well find an error message in the Response body instead of valid JSON, for example.
Sweet Music to My Ears
Fiddler is worthy of its own multi-part series and we do intend to give Fiddler its deserving share of the limelight in the future. Nevertheless, as this particular set of topics has focused on a comprehensive look at server and client-side debugging, we would be amiss to exclude at least an introduction, however brief, of Fiddler.
Fiddlin’ Around
To get started, Fiddler can be downloaded here: http://fiddler2.com/get-fiddler. There is a version for .NET 2 and .NET 4. The installation package is less than 1MB in size, and the installation is quick and easy.
How It Works… in 200 Words or Less
Fiddler was created by Eric Lawrence, then a member of the Internet Explorer team, to more or less “fiddle” with HTTP traffic.
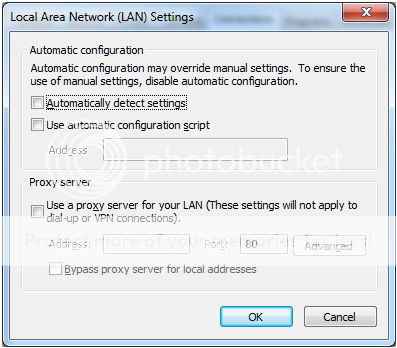
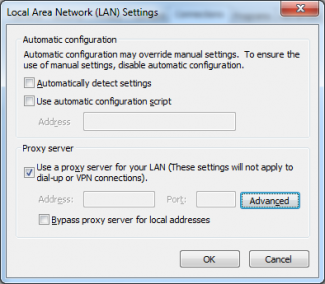
To better understand Fiddler’s capabilities, it’s helpful to understand how this works. Basically Fiddler configures itself as a web proxy on your machine. To view proxy settings for Internet Explorer, go to Internet Options > Connections > LAN Settings and note the Proxy Server section.
As illustrated in this screenshot, we don’t have any proxy settings configured nor do we have Fiddler running.
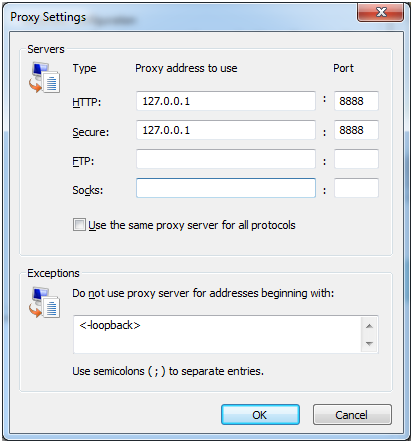
Now if we were to launch Fiddler and check our proxy setting again, you can see that we now have a proxy address pointing to the loopback address (i.e. our own machine) listening on port 8888.
Proxy servers serve as middleware on networks and that’s exactly what Fiddler is doing.
Browser requests will be sent to the configured proxy server (i.e. Fiddler). Fiddler then has the full web request at its disposal for logging and manipulation.
It then makes the request (modified or not) to the server of interest. Likewise, it intercepts all incoming web responses, does its thing, and then forwards it to the browser.
Learning Your First Chord
Let’s do a simple example to illustrate basic usage.
First, launch Fiddler and temporarily toggle off the capturing of traffic via File > Capture Traffic.
Clear any visible traffic by selecting the dropdown next to the ‘X’ on the toolbar and clicking Remove all. Open CRM and navigate to the new case page, then input data for all required fields (but don’t save just yet).
In IE Developer Tools, clear the cache (or have Cache > Always refresh from server toggled on). Toggle the capturing of traffic back on in Fiddler, save the new case record, then toggle it off again.
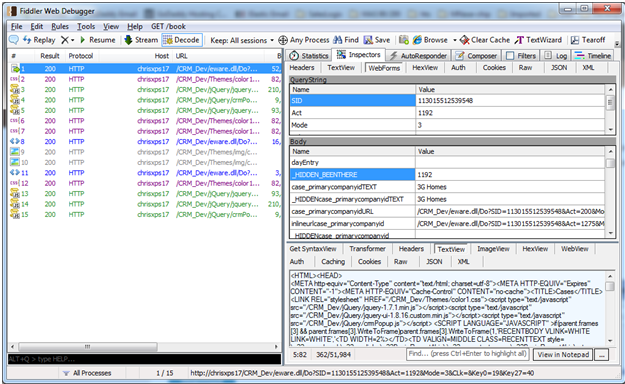
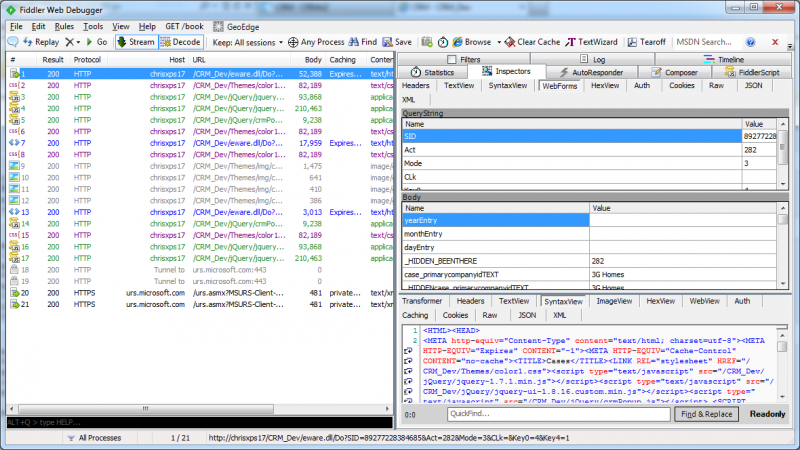
Select the first session on the left then the Inspectors tab on the right. Lastly, select WebForms within the Inspectors tab for the HTTP request (top section) and TextView for the HTTP response (bottom section).
You should see something like this:
Notes of E Major
Fiddler may appear a bit overwhelming at first glance, so let’s break it down.
On the left side, you have all HTTP sessions, where each session is made up of a request and response. In other words, the browser makes a request to the server via a particular web-based resource (URL) using a standard HTTP verb such as GET or POST.
The server then responds with a HTTP response. A session could be for a JavaScript file, a CSS file, a PDF (or other file-based resource), an image, HTML, or even data such as XML and JSON which is typically the case with an AJAX request.
On the right side, you can see the HTTP request and response for a particular session. Not surprisingly, the HTTP request is shown at the top and the response at the bottom.
Though you’ll spend much of your time on the TextView tab for a request, we wanted to illustrate how the WebForms tab can be used to easily view which key/value pairs were transmitted to the server via the query string and HTML body.
By nature, HTTP is a stateless protocol so data passed via the query string and HTML body is critical.
When debugging, it is often helpful to confirm that the form fields (hidden or visible) and query string parameters are being passed as expected. If not, this is likely the source of your problem. On the bottom half (i.e. the response), you can see the actual data returned from the request.
In this case, it’s HTML for the case summary page for the newly created case in CRM.
200 OK
Thank you for joining us in our exploration of server and client-side debugging tools for CRM development.
At the end of the day, Sage CRM is a web application just like any other. It relies on the same technologies and standards – classic ASP, .NET, Java, HTML, CSS, JavaScript, and HTTP – as many other web applications.
Considering this, never lose sight of the fact that there are tools within your reach beyond simply reviewing the CRM logs.
Debugging modern web applications is a complex matter and is a field of study in its own right. Learning the ins and outs of time-tested debugging tools and techniques will make you more effective as a CRM technician and ultimately help you deliver more value to your CRM users.
You’ve been armed with a mighty lot of bug swatters, so swat away!
Return to Top
How to Use Fiddler to Troubleshoot Sage CRM Development
If your goal is to become a masterful Sage CRM debugger (why wouldn’t it be?), Fiddler is a software tool you’ll want to leverage often.
In the previous section, we promised to return once again to the topic of Fiddler, the “web debugging proxy” application. So we’re going to do just that as we explore some of Fiddler’s many capabilities.
Fiddler is a personal favorite of ours and one we rely upon heavily when troubleshooting customizations and Sage CRM in general.
It has come to the rescue time and time again so we’re not shy about singing its praises! Soon enough, we’re confident you’ll be whistling to the tune of Fiddler too.
The Why and What of Fiddler
Web applications, such as Sage CRM, use the HTTP/HTTPS protocol which follows a request/response cycle.
For instance, the browser submits a HTTP request to a server via a specific URL using a “verb” such as GET, POST, etc. with optional query string parameters and request body (possibly JSON, XML, or encoded form data).
The server processes the request and then returns a response (e.g. HTML, JSON, XML, an image file, CSS style sheet, JavaScript file, etc.) back to the browser.
The browser then assimilates these web-based resources and renders a web page (usually).
Being able to investigate the interactions between the browser and server is critical for troubleshooting web applications, especially AJAX-based ones.
This is where Fiddler comes into play, effectively serving as the “middle man” to capture and log HTTP/HTTPS requests and responses for your viewing pleasure. Additionally, you can “fiddle” (hence its name) with requests and responses for troubleshooting and testing purposes.
How Fiddler Works
The magic behind Fiddler is that it configures itself as a proxy server.
A proxy server acts as an intermediary such that a request is first sent to the proxy, then forwarded to the intended recipient from the proxy. Then, in turn, the response is sent back to the proxy which then forwards the response to the original requester.
By configuring itself as a HTTP (and secure [HTTPS]) proxy, Fiddler has visibility into all HTTP interactions. This includes page requests and responses to and from a Sage CRM server, for instance.
Fiddler is Not Launched (or “Capture Traffic” is disabled)
Directly below is a screenshot from Internet Options > Connections > LAN Settings within Internet Explorer. Note that no proxy server is in use.

Fiddler is Capturing Traffic
With Fiddler launched and capturing traffic, there’s now a proxy address for HTTP and Secure pointing to the loopback address (i.e. my own machine) listening on port 8888.
Learning Your First Chord
With the background information out of the way, let’s see Fiddler in action.
Installation
You’ll first need to download and install Fiddler. Fiddler is free and download links for .NET 2 and .NET 4 are located here: http://fiddler2.com/get-fiddler. Installation is straightforward.
Making the Case
To illustrate basic usage, let’s capture the HTTP traffic when creating a new case in Sage CRM.
- Launch the Fiddler application.
- Temporarily turn off traffic capturing from the menu via File > Capture Traffic.
- Open Sage CRM and navigate to the new case page, then input data for all required fields (but don’t save just yet).
- In IE Developer Tools, clear the cache (or have Cache > Always refresh from server toggled on). Clearing the browser cache will force all page resources (JavaScript, CSS, images, etc.) to be reloaded, making the HTTP sessions visible within Fiddler.
- Back in Fiddler, clear any visible traffic by selecting the dropdown next to the ‘X’ icon on the toolbar and clicking Remove all.
- Toggle the capturing of traffic back on, save the new case record in CRM, then toggle it off again.
- Select the first session on the left then the Inspectors tab on the right.
- Lastly, select “WebForms” within the Inspectors tab for the HTTP request (top section) and SyntaxView for the HTTP response (bottom section). Your Fiddler capture should be similar to the screenshot…
Notes of E Major
The tool may appear overwhelming at first glance so let’s break it down briefly.
On the left side are all captured HTTP sessions with usual information such as the resource type, HTTP result code, URL, and so on. Each session is made up of a request and response which is visible on the right side when a HTTP session is selected.
The top section of the right side is the HTTP request. In other words, this is what the browser submitted to the Sage CRM web server. WebForms, as illustrated here, is particularly useful to view key/value pairs (query string and body) submitted to the server.
Confirming all key/value pairs were submitted as expected is an important troubleshooting step when a page is misbehaving.
The bottom section of the right side is the HTTP response. Here, we’re able to view the raw data returned from the request. In this case, it’s HTML for the case summary page for the newly created case.
In Summary
Sure, we’ll admit it – we just shed a tear of joy. Fiddler is an amazing tool and we’re thankful to Eric Lawrence, creator of Fiddler, for his selfless contributions to the web development community.
The tool has an impressive arsenal of powerful features guaranteed to elevate your CRM game. In the coming section, we look forward to sharing its awesomeness with you.
Return to Top
How to Debug Your Sage CRM ASP Pages Inside Visual Studio
Your project is complete and it’s time to run Sage CRM to see all your hard work in action.
You log in, jump though a few hoops and navigate to your newly written page.
Then it happens: you are confronted with an ambiguous error message or even worse, a 500 response from the server.
After turning on ‘Send Errors To Browser’ in IIS and looking at the code, you still don’t see exactly went wrong. You’re left scratching your head and preparing to write dozens if not hundreds of Response.Write lines to try and figure out what is causing the issue.
It’s usually at this point you start to loathe that ASP.NET developer sitting over there with his or her fancy F5 and debug mode in Visual Studio, and you grow envious of setting break points and adding watches.
Well fret no more! You can now connect and debug your server side ASP code from Visual Studio and take advantage of all the goodies it has to offer.
First, you need to enable debugging in IIS. There are a lot of articles out there that cover enabling debugging in IIS however none of them seem to point out that if you want to debug a Virtual Directory, you need to enable debugging on the top level site as well.
This seems trivial but it will prevent you from actually attaching your debugger.
Open IIS and follow these steps to enable debugging:
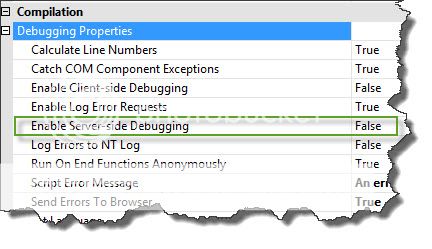
IIS 7:
- Expand Sites
- Select the top level site that CRM resides under
- Under the IIS heading, double click ASP
- Under Compilation set ‘Enable Server-Side Debugging’
- Repeat these steps for the CRM site.
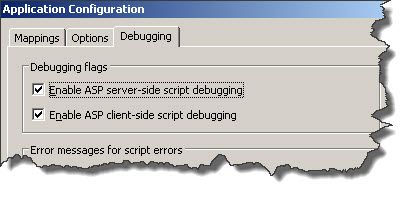
IIS 6:
- Expand Web Sites
- Right click the top level site that Sage CRM reside under
- Select Home Directory and click Configuration
- Go to the Debugging Tab
- Select ‘Enable ASP server-side script debugging’
- Repeat these steps for the CRM site, note that under a virtual directory you will find the Configuration button under Virtual Directory instead of Home Directory.
After you have enabled Server-Side debugging on your machine you just have to attach the debugger from Visual Studio.
Before you attach your debugger, it is important to note that you must first navigate to the page you want to debug so the code you are attempting to debug can be loaded and you can set break points. Once you have navigated to your page in CRM and received your error, it is time to attach the debugger.
Start Visual Studio and open the ASP page you want to debug.
After your page is open in Visual Studio, press CTRL+Alt+P at the same time to open the Attach to Process dialog. Alternatively, you can click Attach to Process under the Debug Menu.
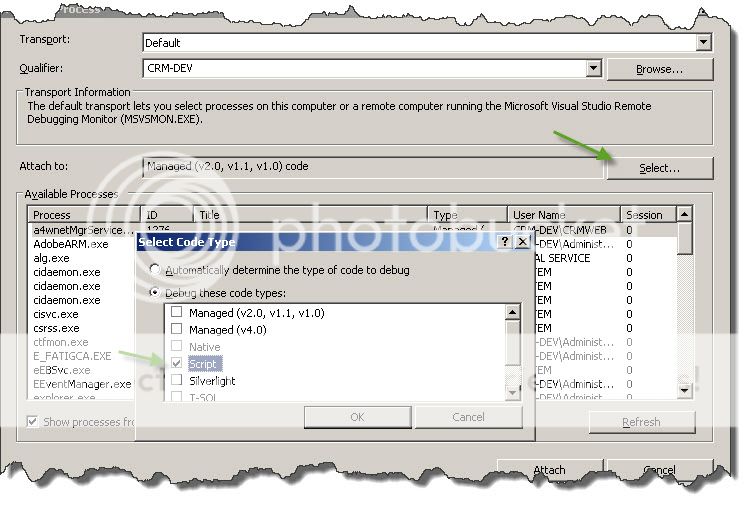
One thing that is often over looked is the need to explicitly specify what type of code you are attaching to.
You must set this to Script, if you leave it as ‘Automatically determine the type of code to debug’ or any other type of code your debugger will not load the code for your asp page.
Click ‘Select’ and select ‘Script’ from the list. Then click Ok to close the Select Code Type dialog.
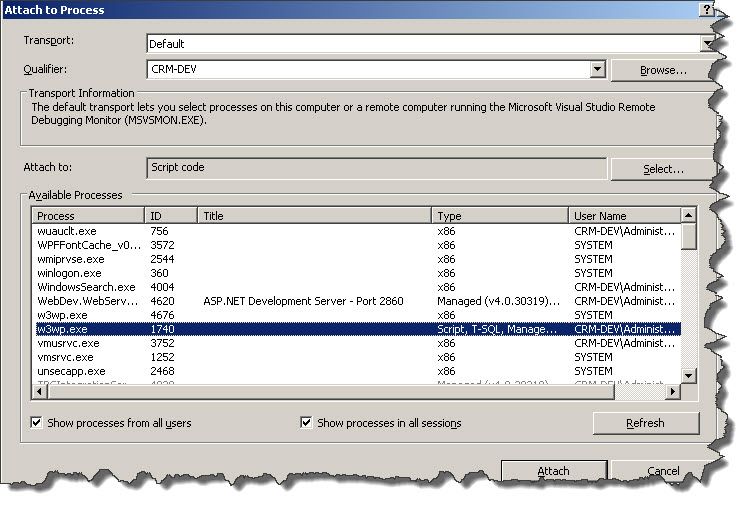
From the list of available processes it is important to select the correct w3wp.exe.
To determine which one is correct look at both the User Name and Type columns: User Name should be the user who is running CRM. In the type column you should see ‘Script, T-SQL, Managed (…), x86’ you might not see all of these and Managed (…) will indicate what, if any, version of the .NET framework is loaded.
This is why it’s important to explicitly state what type of code you want to debug. After you have identified the correct wpw3.exe process simply select it and click Attach.
Now that the debugger is attached all you need to do is set a breakpoint and reload your page in Sage CRM.
Doing this will cause the Visual Studio Debugger to kick and will bring Visual Studio to the front when your break point is hit.Sometimes Visual Studio isn’t brought to the front so you might have to switch back to SVS to check if your break point has been hit yet.
Once your break point has been hit you can use all the goodies of the Visual Studio debugger such as Step Over, Step Into, Breakpoints, Watches and so on.
You no longer need to be jealous of that ASP.NET developer.
You can now take full advantage of the Visual Studio debugger, step through your code and find that reference to the variable that has a lower case ‘r’ instead of the upper case.